
Most brands use some form of loyalty metric as a key performance indicator (KPI). Brand advocacy metrics – or likelihood to recommend metrics – have emerged as the most common ones to use, to the point they are unquestioned at many organizations. The belief is that focus on that one key metric and business will improve.
However, we often hear from organizations struggling that there is a disconnect between their KPIs and actual business outcomes. This is particularly true in terms of correlating to growth. As popular as it is (and effective in many cases), brand advocacy is not a one size fits all metric.
The need to link KPIs to business growth objectives
One such situation we experienced in recent years was for a retail brand looking to grow current customers existing business beyond their core need states that the brand was already satisfying. Brand advocacy was the wrong metric to use to assess performance against this objective, as how a consumer scored this metric had little to no impact on their likelihood to use the brand in the stated growth need state. With a hypotheses driven approach we were able to identify potential options and found an alternative consumer metric that correlated to the stated business objective.
Brand Advocacy vs. Brand Favoritism
Retail and other service brands often face a more varied competitive context than manufactured goods, as which one a shopper selects is more significantly impacted by situational based need states. While an individual shopper’s (say) toothpaste needs don’t typically change much from purchase to purchase, what they are looking for from a retailer, restaurant, entertainment venue, or other service or experience provider can – and does – vary greatly.
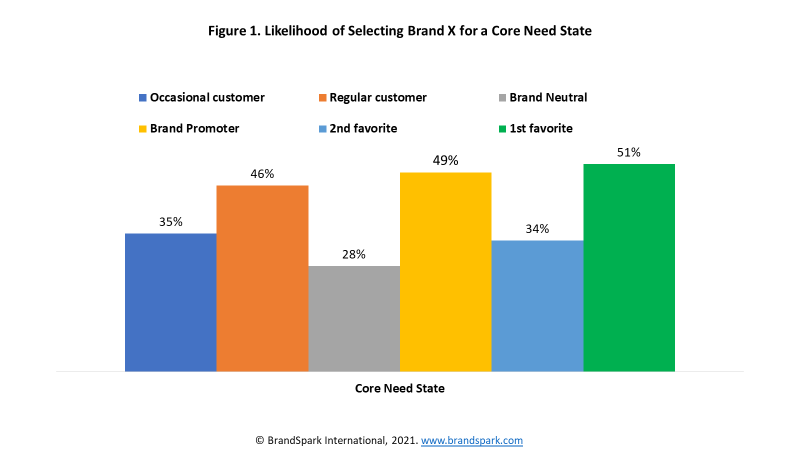
One particular retail brand we worked with had a strong core business, but – like most – were looking to drive growth by increasing frequency from its own user base. In order to ensure the research aligned with this objective, we conducted a detailed analysis of how different loyalty metrics correlated with likelihood to use them for different need states (of which there were over a dozen in total). While other metrics were also considered, here we are focusing on brand advocacy vs. brand favoritism.
There was one need state the brand was – as we already knew – particularly strong in. This was key to driving their current brand usage. When we compared brand advocacy to favoritism, there was essentially no difference (see figure 1). Shifting someone from “neutral” to brand advocate had essentially the same impact as moving from 2nd favorite to favorite, and it correlated strongly to overall usage frequency. Basically it didn’t really matter which metric you use.
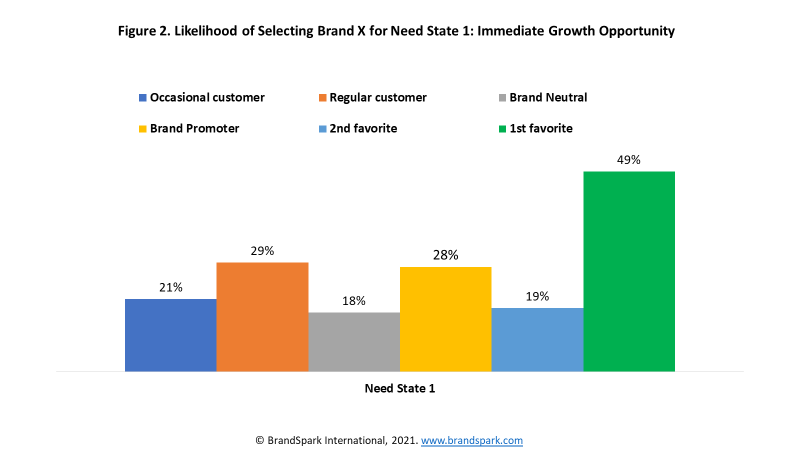
Another need state was identified as a strong immediate growth opportunity, as it was moderately similar to their core one. Using the same metrics as above, we start seeing some clear differentiation between the metrics. While brand advocates are a bit more likely than neutrals to select them, the difference between favorite and second favorite was much greater. In fact, those that selected brand as their favorite were already using the brand as much for this need state as the core one.
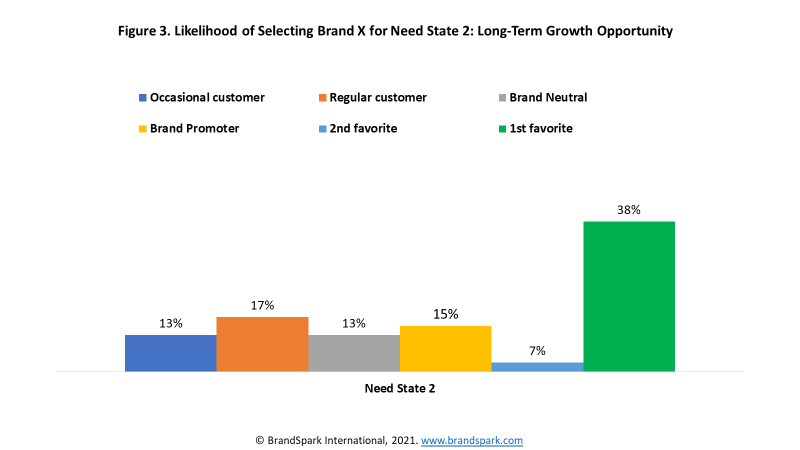
In addition to the immediate growth opportunity, another need state was identified as a long-term strategic objective given its sheer size – though more significant work would need to be done to potentially capitalize on it. And for this one, the differences between the metrics stood out even more. Current brand advocacy had almost no impact on likelihood to use the brand for this need state, while brand favoritism had a huge one.
Brand Favoritism proved to be the better KPI for this objective
By switching the key KPI focus to brand favoritism instead of advocacy, and re-orientating the analysis around that, we were able to provide much clearer insight on how to drive growth in target need states. While it also proved to work equally as well for assessing performance in the core need state. This made it unquestionably better for linking brand study KPIs to core business objectives.
Making multiple KPIs work together
This finding didn’t mean walking away from brand advocacy all together. It continued to be used where it was most impactful, which was in customer satisfaction studies. These are fundamentally different from brand studies, particularly since customers know they come from the brand, and were typically conducted shortly after the visit. The advocacy metric continued to work very well in this context.
And the added benefit of switching the brand study KPI was we were no longer faced with having two different advocacy scores, where the same question is asked in different contexts – one from the customer satisfaction study, one from the brand study. Those in the former are invariably significantly higher than in the latter, as the brand studies are both blinded and asked in relation to a competitive set.
From a research perspective, the differences are easy to understand. But it’s challenging to get other stakeholders to understand these differences, and can lead to lots of internal issues in terms of disseminating the research results to drive real business impact. Even without the better linkage to KPIs, its typically best to avoid reporting on the same question asked in different contexts as much as possible.
Some key benefits of Brand Favoritism – and other single select loyalty questions
So why was brand favoritism better – or more specifically why did it better link to these core business objectives? There are a number of reasons, but one critical factor is the benefit of forced single-select loyalty questions in brand studies over multi-select ones, particularly in services. When you ask advocacy / recommendation questions in service-focused brand studies, it is not uncommon for a large segment of respondents to recommend multiple brands – as in their heads they might recommend them each for different reasons/ need states. At the same time, others don’t recommend any – just because of the pre-disposition of the respondent.
But if someone is recommending multiple brands, how loyal really are they? And aren’t the customers that simply don’t recommend any brands also important? Single select loyalty questions like “favorite” help overcome this, while also being intuitively easy to understand.
Similar logic applies to how we approach brand trust, which we research extensively in relation to our Sister Company’s BrandSpark Most Trusted Awards (BMTA) program. Being the most trusted brand is highly correlated to market share across categories, which we then take a step further by focusing on how much more the brand is trusted then the closest alternate. You can read more about this approach here (and here and here and here).
This is just one example of how BrandSpark approaches ensuring the KPIs we use are customized to meet our client’s core business objectives. If you’d like to learn more, contact us.