
With the latest round of winners being announced for the BrandSpark Most Trusted Awards (BMTAs), we now have fresh data on about 100 new categories in each of Canada and the U.S. We are using it to better understand the underlying dynamics in each one – and particularly what companies can do to improve their trust positioning within them. Our foundation for this analysis is the BrandSpark Trust and Stubbornness Model, which my colleague Scott Boyer introduced back in January– and expanded on several times.
This framework, as shown in figure 1 (using Canadian data), allows us to understand each category based on two key dynamics:
1. The size of the trust lead in the category
2. How much more shoppers trust the leading brand over the next alternative – what we call “brand stubbornness”.
This second dimension is particularly important, as it tells a story about how resilient (or vulnerable) a brand’s trust share is. This has implications in both in the short-term (such as ability to withstand deep discounting from competitors) and long-term (ability to maintain and grow market share).
Figure 1: 2021 BrandSpark Trust & Stubbornness Model – Canadian Service & E-Com Categories
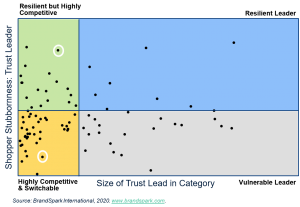
Consider, for example, the two categories circled in figure 1. Both winning brands have similar trust leads in their categories, which makes it appear like they are in very similar competitive positions. But the brand stubbornness data tells a different story.
The brand in the upper left quadrant (resilient but highly competitive) has one of the highest brand stubbornness scores in the database – meaning those that trust them are very reluctant to consider alternatives. This allows that brand to focus mostly on “offense”, knowing that their core base of shoppers is very secure.
The brand in the bottom left quadrant has one of the lowest brand stubbornness scores – meaning those that trust them will switch to an alternative quite easily. That points towards very different strategies and tactics being required – including more investments in protecting their current share, particularly in the face of aggressive marketing and/or deep discounting from key competitors.
In addition to the topline data for both winner and challenger brands across the categories, BrandSpark also captures performance on eight underlying drivers, ranging from quality to transparency- allowing us to understand not only what is happening, but why. From this base we can provide analysis in relation to direct competitors, winner benchmarks, and comparisons to the U.S. – all of which can help a brand shore up its brand stubbornness, while growing trust (and ultimately market) share.
If you work for a brand competing in any of the new BMTA categories, or the 150 CPG categories fom earlier this year, feel free to inquire about receiving a free topline report.