
Introduction
Back in June we explained how shopper trust and stubbornness dynamics are different in Canada than the U.S for the vast majority of categories. This has significant implications for brand teams that might try to use similar strategies on both sides of the border.
Today we’re going to go a little deeper, providing a real (but blinded) case study from one of the BMTA food categories we looked at in both markets. This case study provides a vivid example of how important it is to understand not only how trust and stubbornness levels are different between the two countries, but why.
Key Insights
In this particular food category there is a “challenger brand” that has emerged to capture just under 10% “most trusted” share in each market. In turn, it would seem easy to believe that the brand has similar opportunities to emerge in both markets, and both could be approached in similar ways.
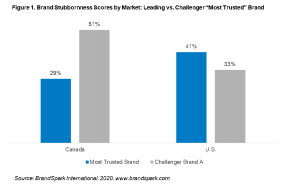
However, when you look at the brand’s stubbornness score – how much more shoppers trust that brand over alternatives – the two markets look starkly different. In Canada it has a significantly higher stubbornness score than the market trust leader, performing at BMTA “gold standard” benchmark levels. In the US, it has a significantly lower stubbornness score than the market trust leader, falling the BMTA “red flag” zone.
So obviously the question is why – why does a brand that initially looks so similar in both markets in fact face such different competitive dynamics? While there are a few underlying factors, the biggest one is that the underlying drivers of trust and stubbornness in each market are fundamentally different.
In Canada, out of the 8 different drivers we analyze, “values”, “quality”, and “transparency” are the top-3 – with “fair price” coming in near the bottom. In the U.S.., “quality” is also in the top-3 – but joined instead by “fair price” and “recommend”, while “transparency” falls towards the bottom.
What it Means
Given the significant differences in trust and stubbornness drivers between the two markets, it points towards the brand considering very different strategies in both markets to further grow trust and market share.
While this post is just focused on one brand in one category, similar stories – ranging from totally different dynamics to subtle differences – emerge in most of the 127 CPG categories we’ve looked at. In fact, in only about 5% of cases do categories have the same leader & top challenger brands, with similar relative trust and stubbornness scores.
Understanding the differences in the other 95% is important – and we expect the same general trend will exist when we take a deep look at the BMTA Service categories next month.
If you’d like to learn more about our trust and stubbornness insights we encourage you to read our various posts on the topic, and if you work for a brand in any of the categories in this year’s BMTA awards feel free to contact us for a topline report.