
Click here to watch the full webinar on this topic
Share This Post
Share on facebook
Share on linkedin
Share on twitter
Share on email
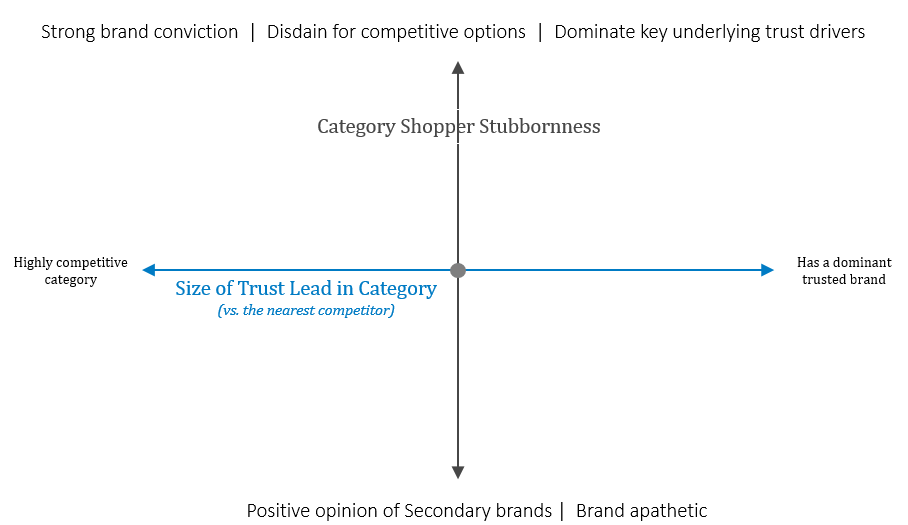
Overview of the BrandSpark Shopper Trust & Stubbornness Framework
The BSTSF is a 2×2 built off of two key metrics. The first, or x-axis, is based on open-ended feedback on which brand shoppers trust the most in a given category. The winner is whichever brand is selected the most. The further to the right a category lands, the bigger lead the Most Trusted brand has.
The second, or y-axis, is derived based on proprietary assessment of how shoppers feel about their most trusted brand in relation to their next closest alternative. A particular focus is placed on the willingness to trade-off between them, and the key factors explaining why.
Figure 1. The BrandSpark Shopper Trust & Stubbornness Framework (BSTSF)
CPG Food categories in the BSTSF
Intuitively it might seem reasonable to expect a fairly linear relationship between these two metrics. But BrandSpark has found this is not the case. For example, figure 2 shows where each food category landed in the 2019 BCSS, which is much closer to a random scatterplot than a strong linear relationship. Similar dynamics exist in non-food CPG categories as well.
Figure 2. Different food categories plotted in the BSTSF
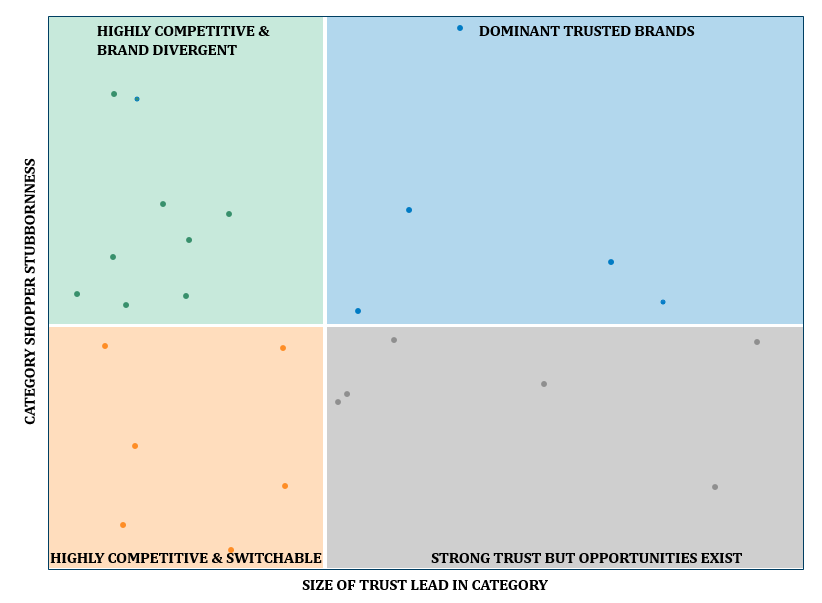
Understanding which quadrant your category lies in, and where your brand fits within the shopper trust hierarchy, has significant implications on trusted-based marketing strategy. Over the coming weeks I will be providing examples of similar-looking categories that happen to fall within each of the 4 different quadrants, and the different strategies and tactics this points towards brands needing to use to be successful.
Alternatively, if you would like to learn more you can register to view my recent webinar on this topic here, or contact us to discuss.
The better you understand how stubborn your brand and category shoppers are, the more effective your marketing strategy and tactics will be.
See Part 2 in this series.
Share This Post
Share on facebook
Share on linkedin
Share on twitter
Share on email